by Jeff
Bowen
Abstract
Undergraduates studying general relativity need
guidance to develop useful skills. A step-by-step worksheet
for plotting the Schwarzschild light cones is presented and
described. First, the students seek to characterize the
null rays by setting the metric ds2 to
zero. For Schwarzschild in Eddington-Finkelstein
coordinates, there are then three different types of
solutions. These are expressed in terms of
 , and conditions for the slope , and conditions for the slope
 are found. Finally, a table of r and light cone slope
values makes it easy to draw typical light cones on a
are found. Finally, a table of r and light cone slope
values makes it easy to draw typical light cones on a plot. plot.

Introduction
I have taught a
general relativity course at Bucknell many times over the
last twenty years. I used Misner, Thorne, and Wheeler the
first few times, and then, when it became available in 2003,
Jim Hartle's Gravity the last two times. One tool
that I find particularly useful to help students visualize
the structure of curved spacetime is a plot of the light
cones at various places. It is especially effective when
the students create the plot themselves.
Analysis
of Worksheet
To that end, I have developed a worksheet on
constructing light cone plots for use in class. (A copy of
the worksheet is attached as the last page.) Before using
this worksheet, students have seen the static spherical
solution in Schwarzschild coordinates, and have gone through
the algebra to transform to Eddington-Finkelstein
coordinates. Now with the worksheet, it's time to get a
feel for the coordinates and the nature of the horizon by
comparing the light cone structure of Schwarzschild with
that of flat Minkowski spacetime.
In class, I have my
students pair up at their tables, and each student has a
separate worksheet. The idea is that they complete the
sheet in collaboration with their partner, and I interact
with the class as a whole as we go through each part.
For the first part, I ask
things like, "Why the zero on the left?" or "What happened
to the dq
part?". I may also do some individual coaching; for
instance, "What simple functional form could v take
for the first type?" (Answer: any constant).
For part II of the
worksheet, I encourage students to use the results from part
I to change to the new time-like variable, and to check that
their answer is the same as my given answer.
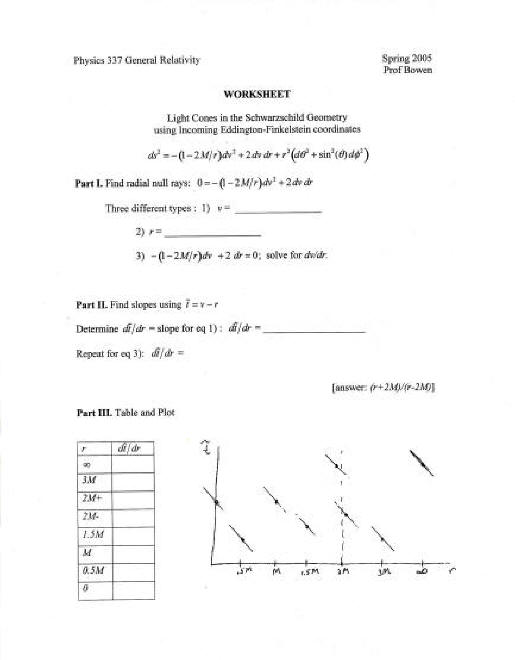
For part III, the
students should use the results of I.2), II.1) and II.3) to
construct line segments through my given points on the  plot.
For the part II.3) result, they should first fill out the
short table of slope values for representative locations.
Most students correctly interpret the 2M+ and 2M- notation
to mean approaching 2M from just above and just below, so
answers like "big positive" or "big negative" are
sufficient. What's important is that they can translate
their entries to the plot. plot.
For the part II.3) result, they should first fill out the
short table of slope values for representative locations.
Most students correctly interpret the 2M+ and 2M- notation
to mean approaching 2M from just above and just below, so
answers like "big positive" or "big negative" are
sufficient. What's important is that they can translate
their entries to the plot.
The last thing to put in
the plots is to indicate which way the light cones open.
Students can show this by drawing little ellipses onto the
X's they've made at the various locations on the plot. The
ellipse should connect two adjacent rays that form the X,
and also cover the time-like region between the rays.
For example, look at the
r = 3M point, and consider the line r = 3M
(with q and
f constant). Is
this time-like? By putting these values into the original
metric, students can see that
so yes, the path is time-like. This means the ellipses are
drawn horizontally so that the forward light cone opens
upward on the plot. On the other hand, the line at r = M
is spacelike, so the forward cones open upward and to the
left.
Conclusion
When all the plots are completed, we conclude the
exercise with a discussion of what the plot can tell you:
how the light cones tip, and what consequences that tipping
might have for particle motion in Schwarzschild. The nature
of a horizon is revealed!
|